4 Plotting
This section covers static and interactive plotting in terra.
4.1 Static Plots
The look and feel of plotting in terra has not changed much from plotting in
raster. It is still pretty straightforward, but not very feature rich. There
are now convenience functions (below) so you don’t have to keep typing
add=TRUE over and over again. And the y argument of terra::plot() allows
you to specify which layers you want to plot, and in what order.
#create outline of temp with luxembourg vector
annual_temp_mask = mask(annual_temp, lux, touches=FALSE)

plot(annual_temp_mask, y=1, col=temp_pal, box=FALSE, axes=FALSE,
     main='Annual Mean Temperature for Luxembourg (Celsius)')
polys(lux, lwd=3)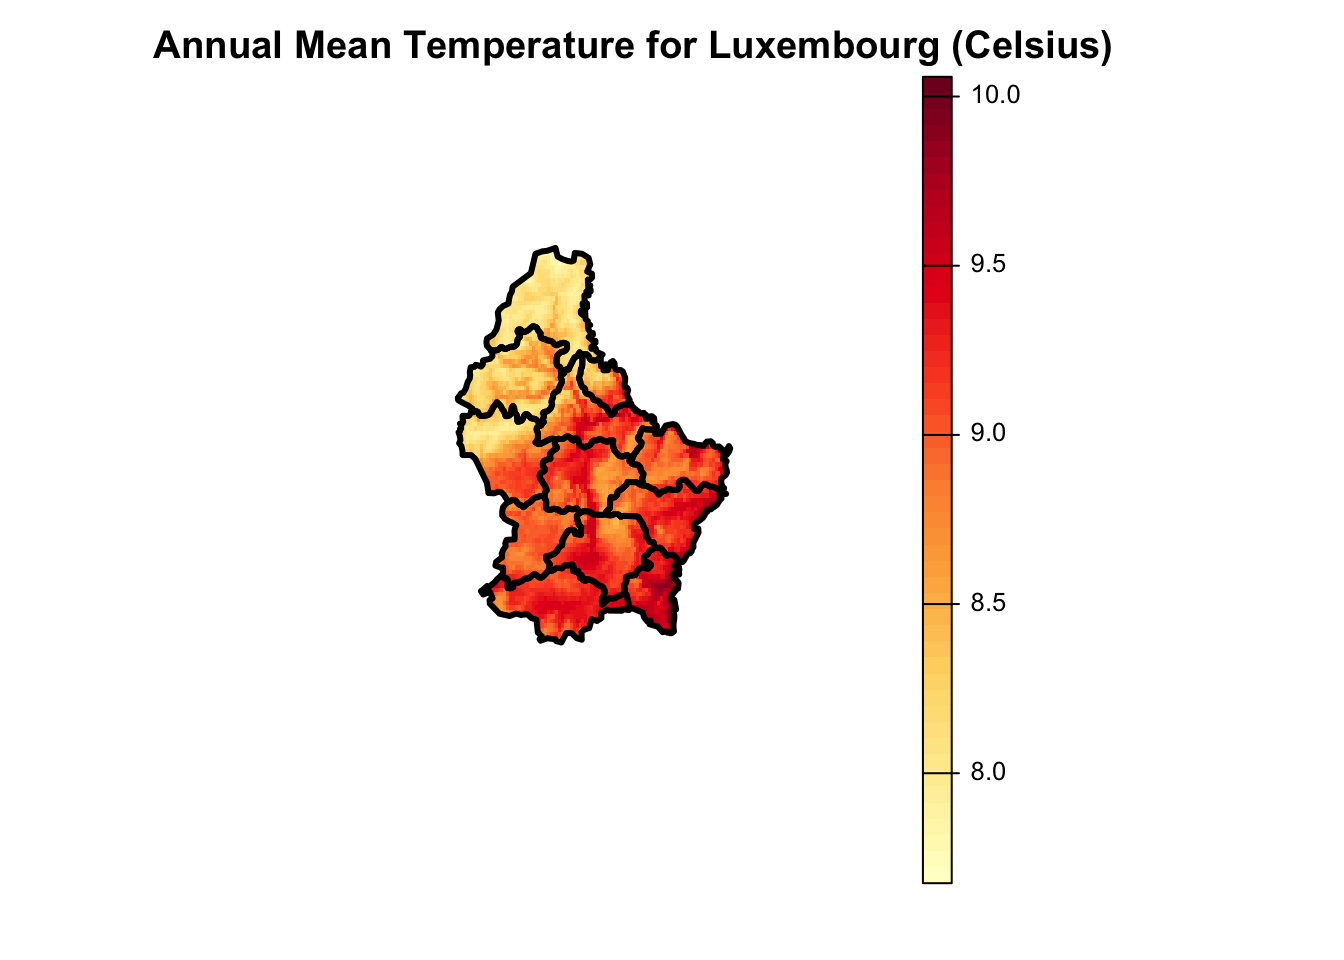
If you want to plot multiple layers with vector overlays, you will need to use
the fun argument. This is a function that is applied to each of the layers in
the plot. The function may have one argument which is the layer that is being
plotted. In the code below, the backslash (\) replaces the
function call for brevity. Unfortunately I have yet to figure out how to
include an overarching title on a plot that has multiple layers.
#create outline of precip with luxembourg vector
seasonal_precip_mask = mask(seasonal_precip, lux, touches=FALSE)[[c(2,3,4,1)]]

#Plot Season precipitation (in mm)
plot(seasonal_precip_mask, fun=\() lines(lux), range=c(60, 100),
      loc.main="topright", col=precip_pal, axes=FALSE)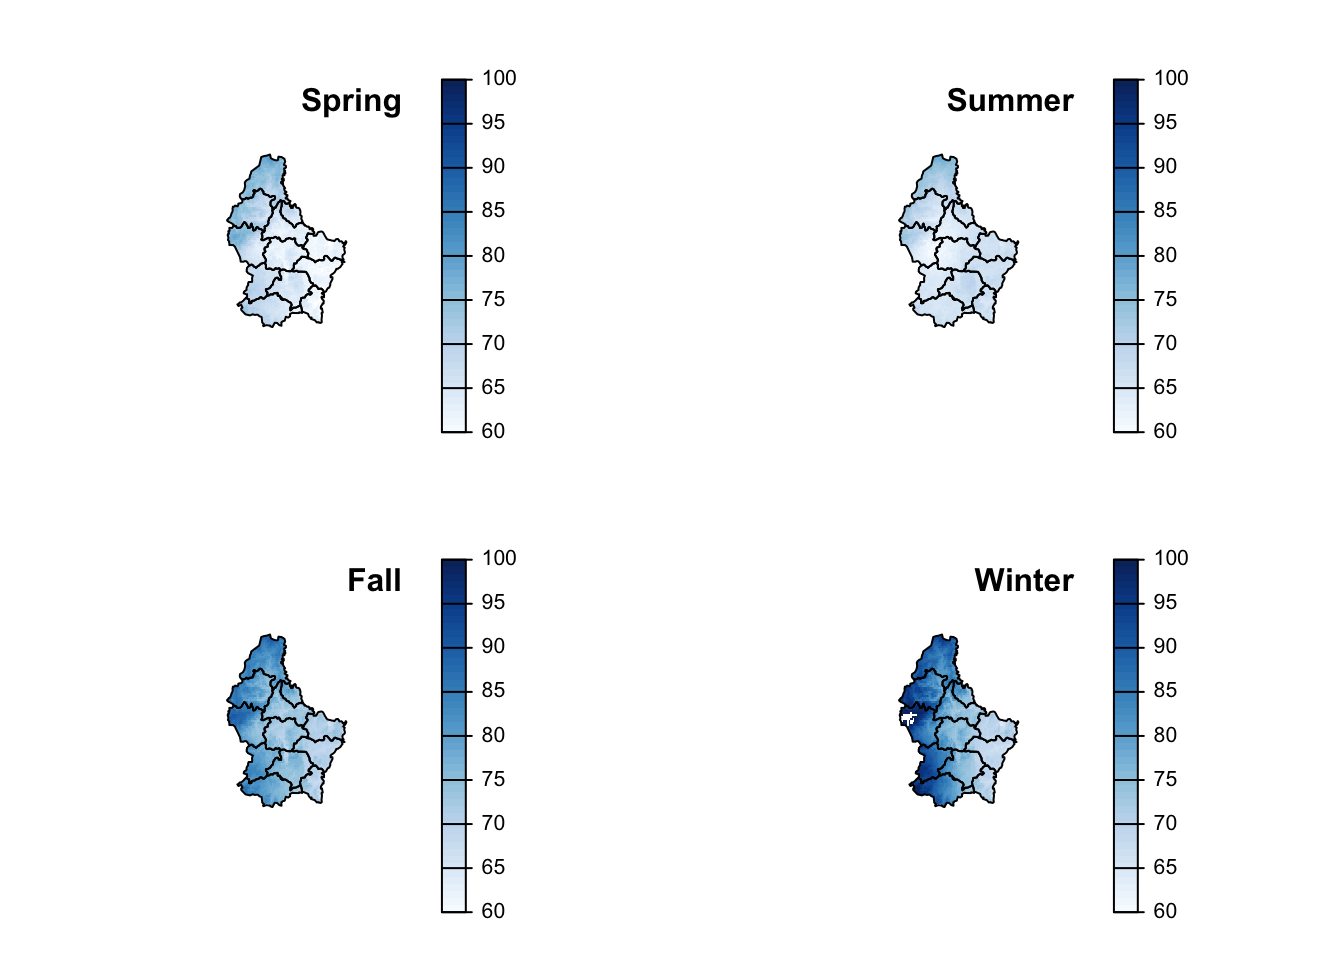
To avoid duplicated legends, use panel() instead of plot(). Almost all the
syntax is the same, but you can specify the number of rows (nr)
and number of columns (nc) to use when plotting the raster layers.
#Plot Season precipitation (in mm)
panel(seasonal_precip_mask, fun=\() lines(lux),
      loc.main="topright", col=precip_pal, axes=FALSE)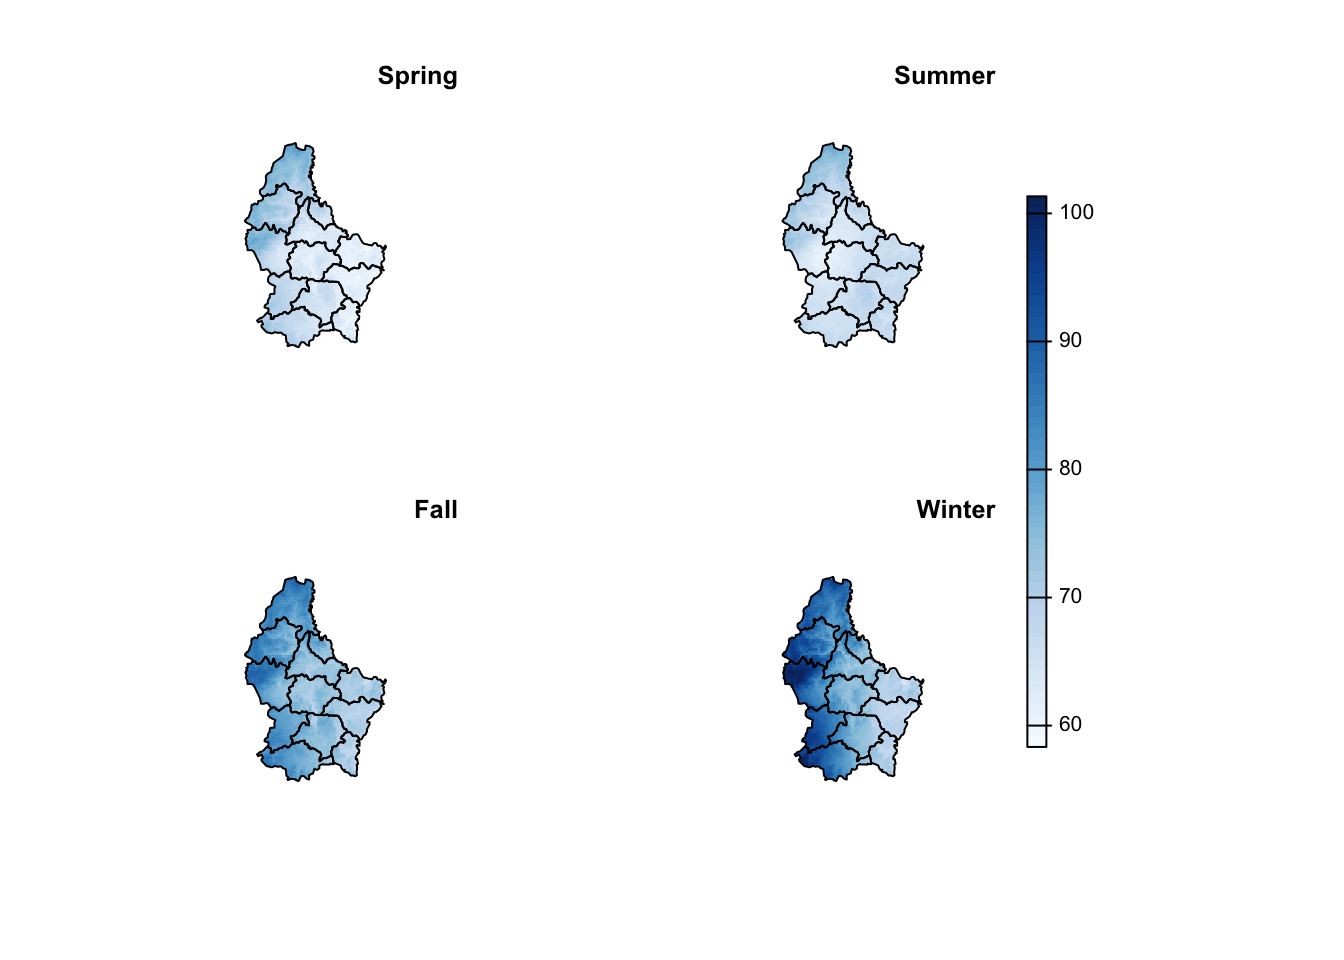
4.2 Interactive Plots
Interactive plotting (with leaflet) is available in terra using the function
plet. It requires leaflet version 2.1.1, which is now on CRAN, so
installing from github is not necessary. To add vectors to the interactive
plots you have to pipe (|>) the interactive plot into a function that adds
vector imagery to the plot (see below). To switch between layers of a multilayer
interactive plot, click on the square in the upper right hand corner of the plot.