Functions can be like personalized Mini Packages
There are two main uses for functions that I can think of right now, one is to make yourself nifty little mini packages and the other is to make iteration easier. Let’s start with the first instance
You may often find yourself in a situation where you need to do the same thing (or set of things) in R, over and over again. One thing that I often want to do is to look at a plant species range map. I generally pull occurence data from the Global Biodiversity Information Facility (GBIF), limiting the search to locations correspoding to a museum collection. This does not take many lines of code but I usually have to look it up. To make my life easier I can write a function to do this task and save the function to be accessible in any of my R sessions.
The first step is to call GBIF and import the dataset of species occurrences
library(rgbif)
library(ggplot2)

GBIF_Frax = occ_search(scientificName = "Fraxinus velutina", hasCoordinate = TRUE, basisOfRecord = "PRESERVED_SPECIMEN")
Then I need to select just the data not the metadata that comes with
Frax_dat <- GBIF_Frax$dataThen I can plot the occurrences
wm <- borders("world", colour="gray50", fill="gray50") #map backgroud
ggplot()+ coord_fixed() + wm +
  geom_point(data = Frax_dat, aes(x = decimalLongitude, y = decimalLatitude),
             colour = "darkred", size = 0.5) +
  theme_bw() + ggtitle(Frax_dat$scientificName)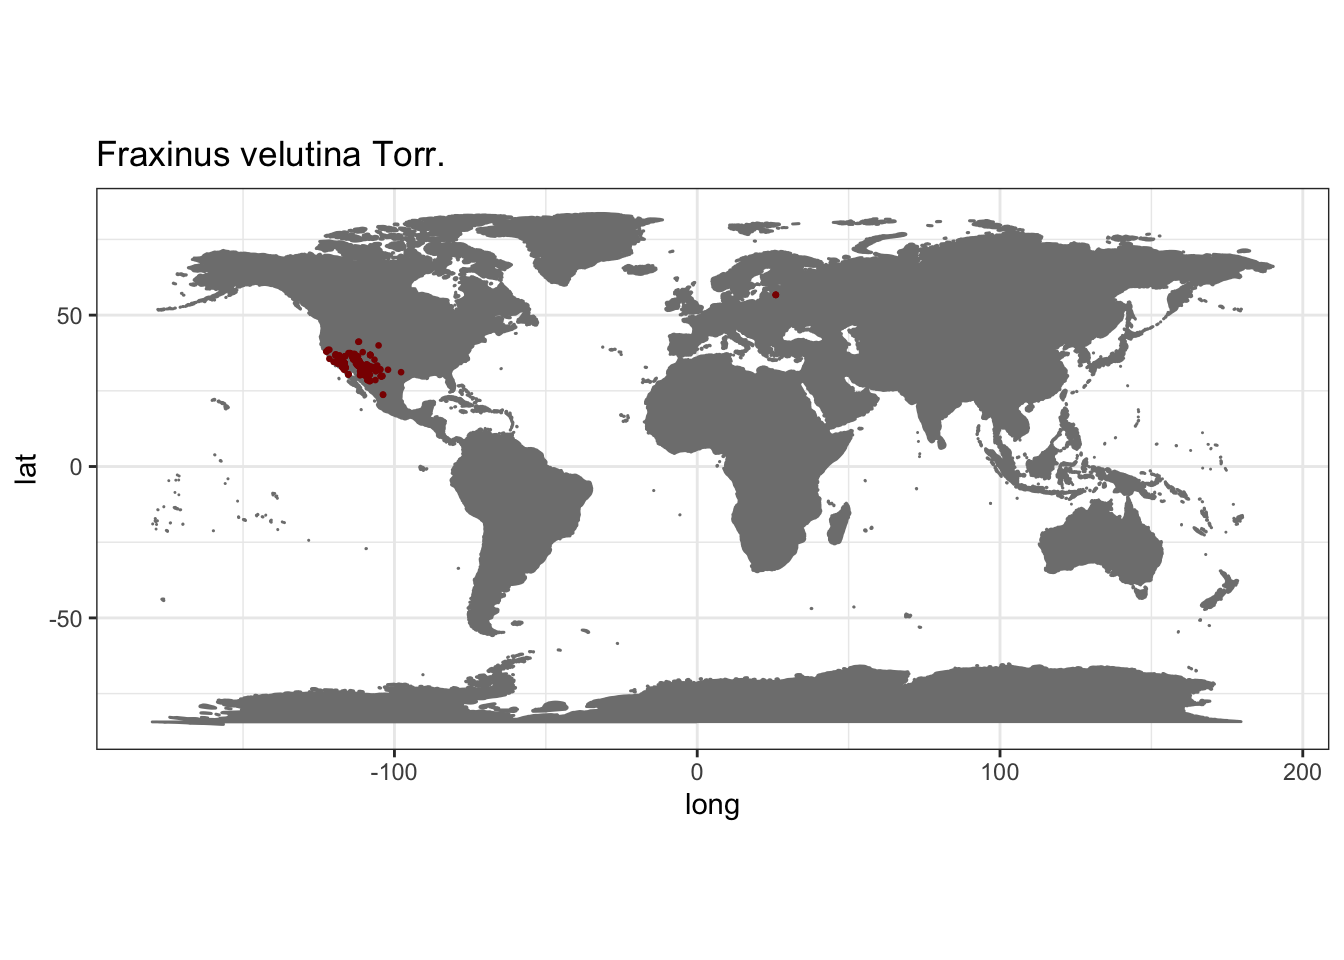
This is a fairly easy piece of code to turn into a function. If I were to do this with a different species, the only piece of information that changes is the speices name. So in my function, that is what I specify as the variable.
 dist_map <- function(x) {
  GBIFdata = occ_search(scientificName = x, limit = 300, hasCoordinate = TRUE, basisOfRecord = "PRESERVED_SPECIMEN")
dat = GBIFdata$data
wm = borders("world", colour="gray50", fill="gray50") #map backgroud
p = ggplot()+ coord_fixed() + wm +
  geom_point(data = dat, aes(x = decimalLongitude, y = decimalLatitude),
             colour = "darkred", size = 0.5) +
  theme_bw() + ggtitle(dat$scientificName)
plot_list = p # save plot
return(p)
 }
Now when I want a species range map I can just use one line of code
dist_map("Fremontodendron californicum")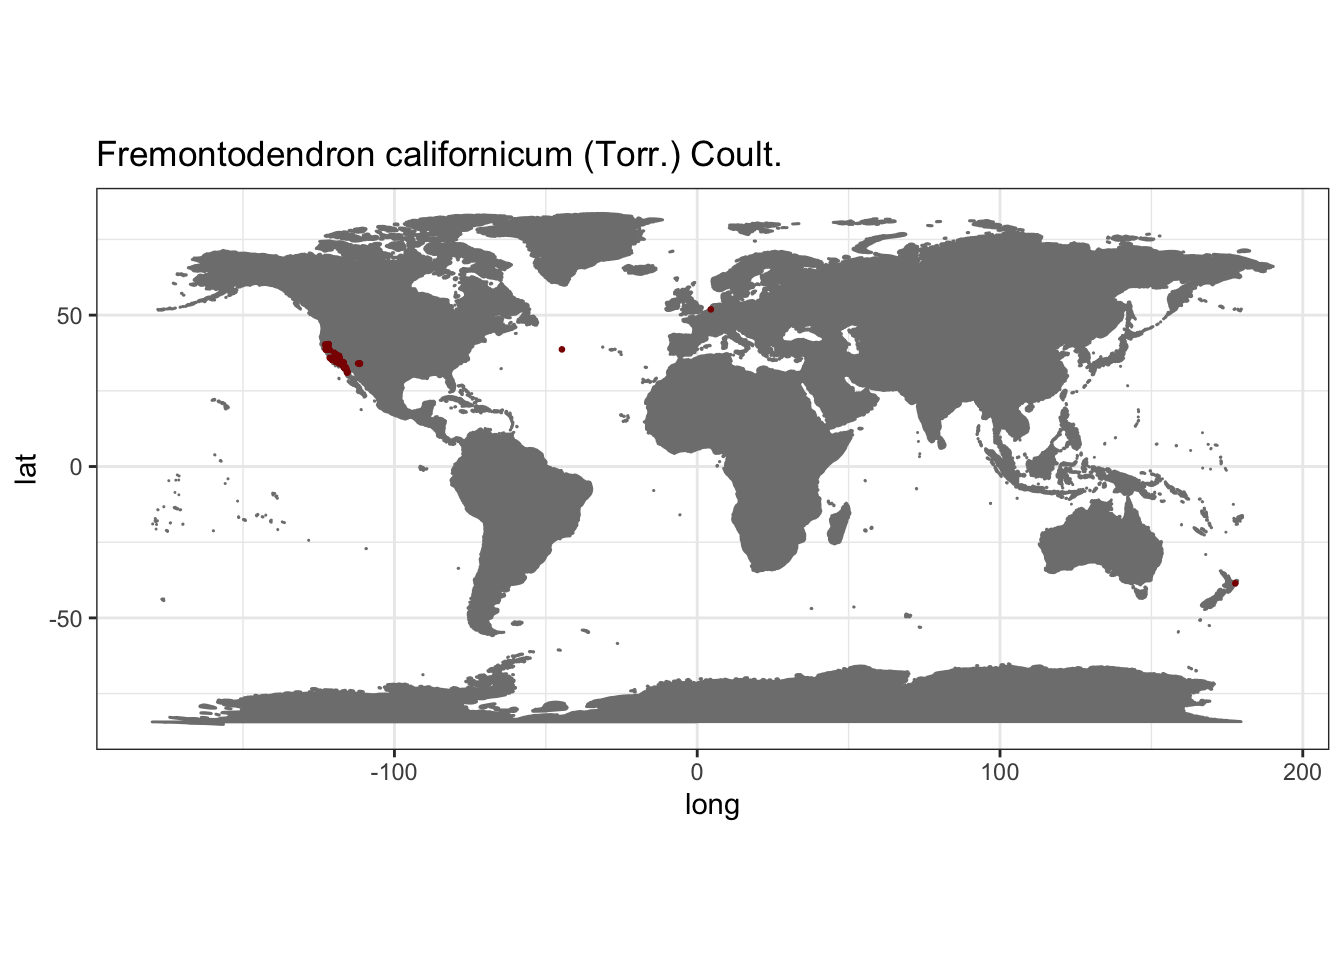
I can save that function to a separate script if I want to use it again in the future. I have a directory for my functions “~Desktop/R-functions” where I saved it.
Now I can call it in any of my other script using the source() function.
source("~/Documents/R_Projects/D-RUG/iterations/dist_map.R")

dist_map("Fremontodendron californicum")