Iteration
Up until this point, we have been able to download and map the range of one plant species at a time. However, what if we want to download the data for and create a range map of several plant species? This is where iteration comes into play!
Essentially, iteration is a way of running the code you wrote in your function multiple times. So if you ever find yourself copy-pasting, then you could likely benefit from using iteration.
There are three main ways to do iterations:
- For Loops
- Apply functions
- Map functions
0.1 Objective
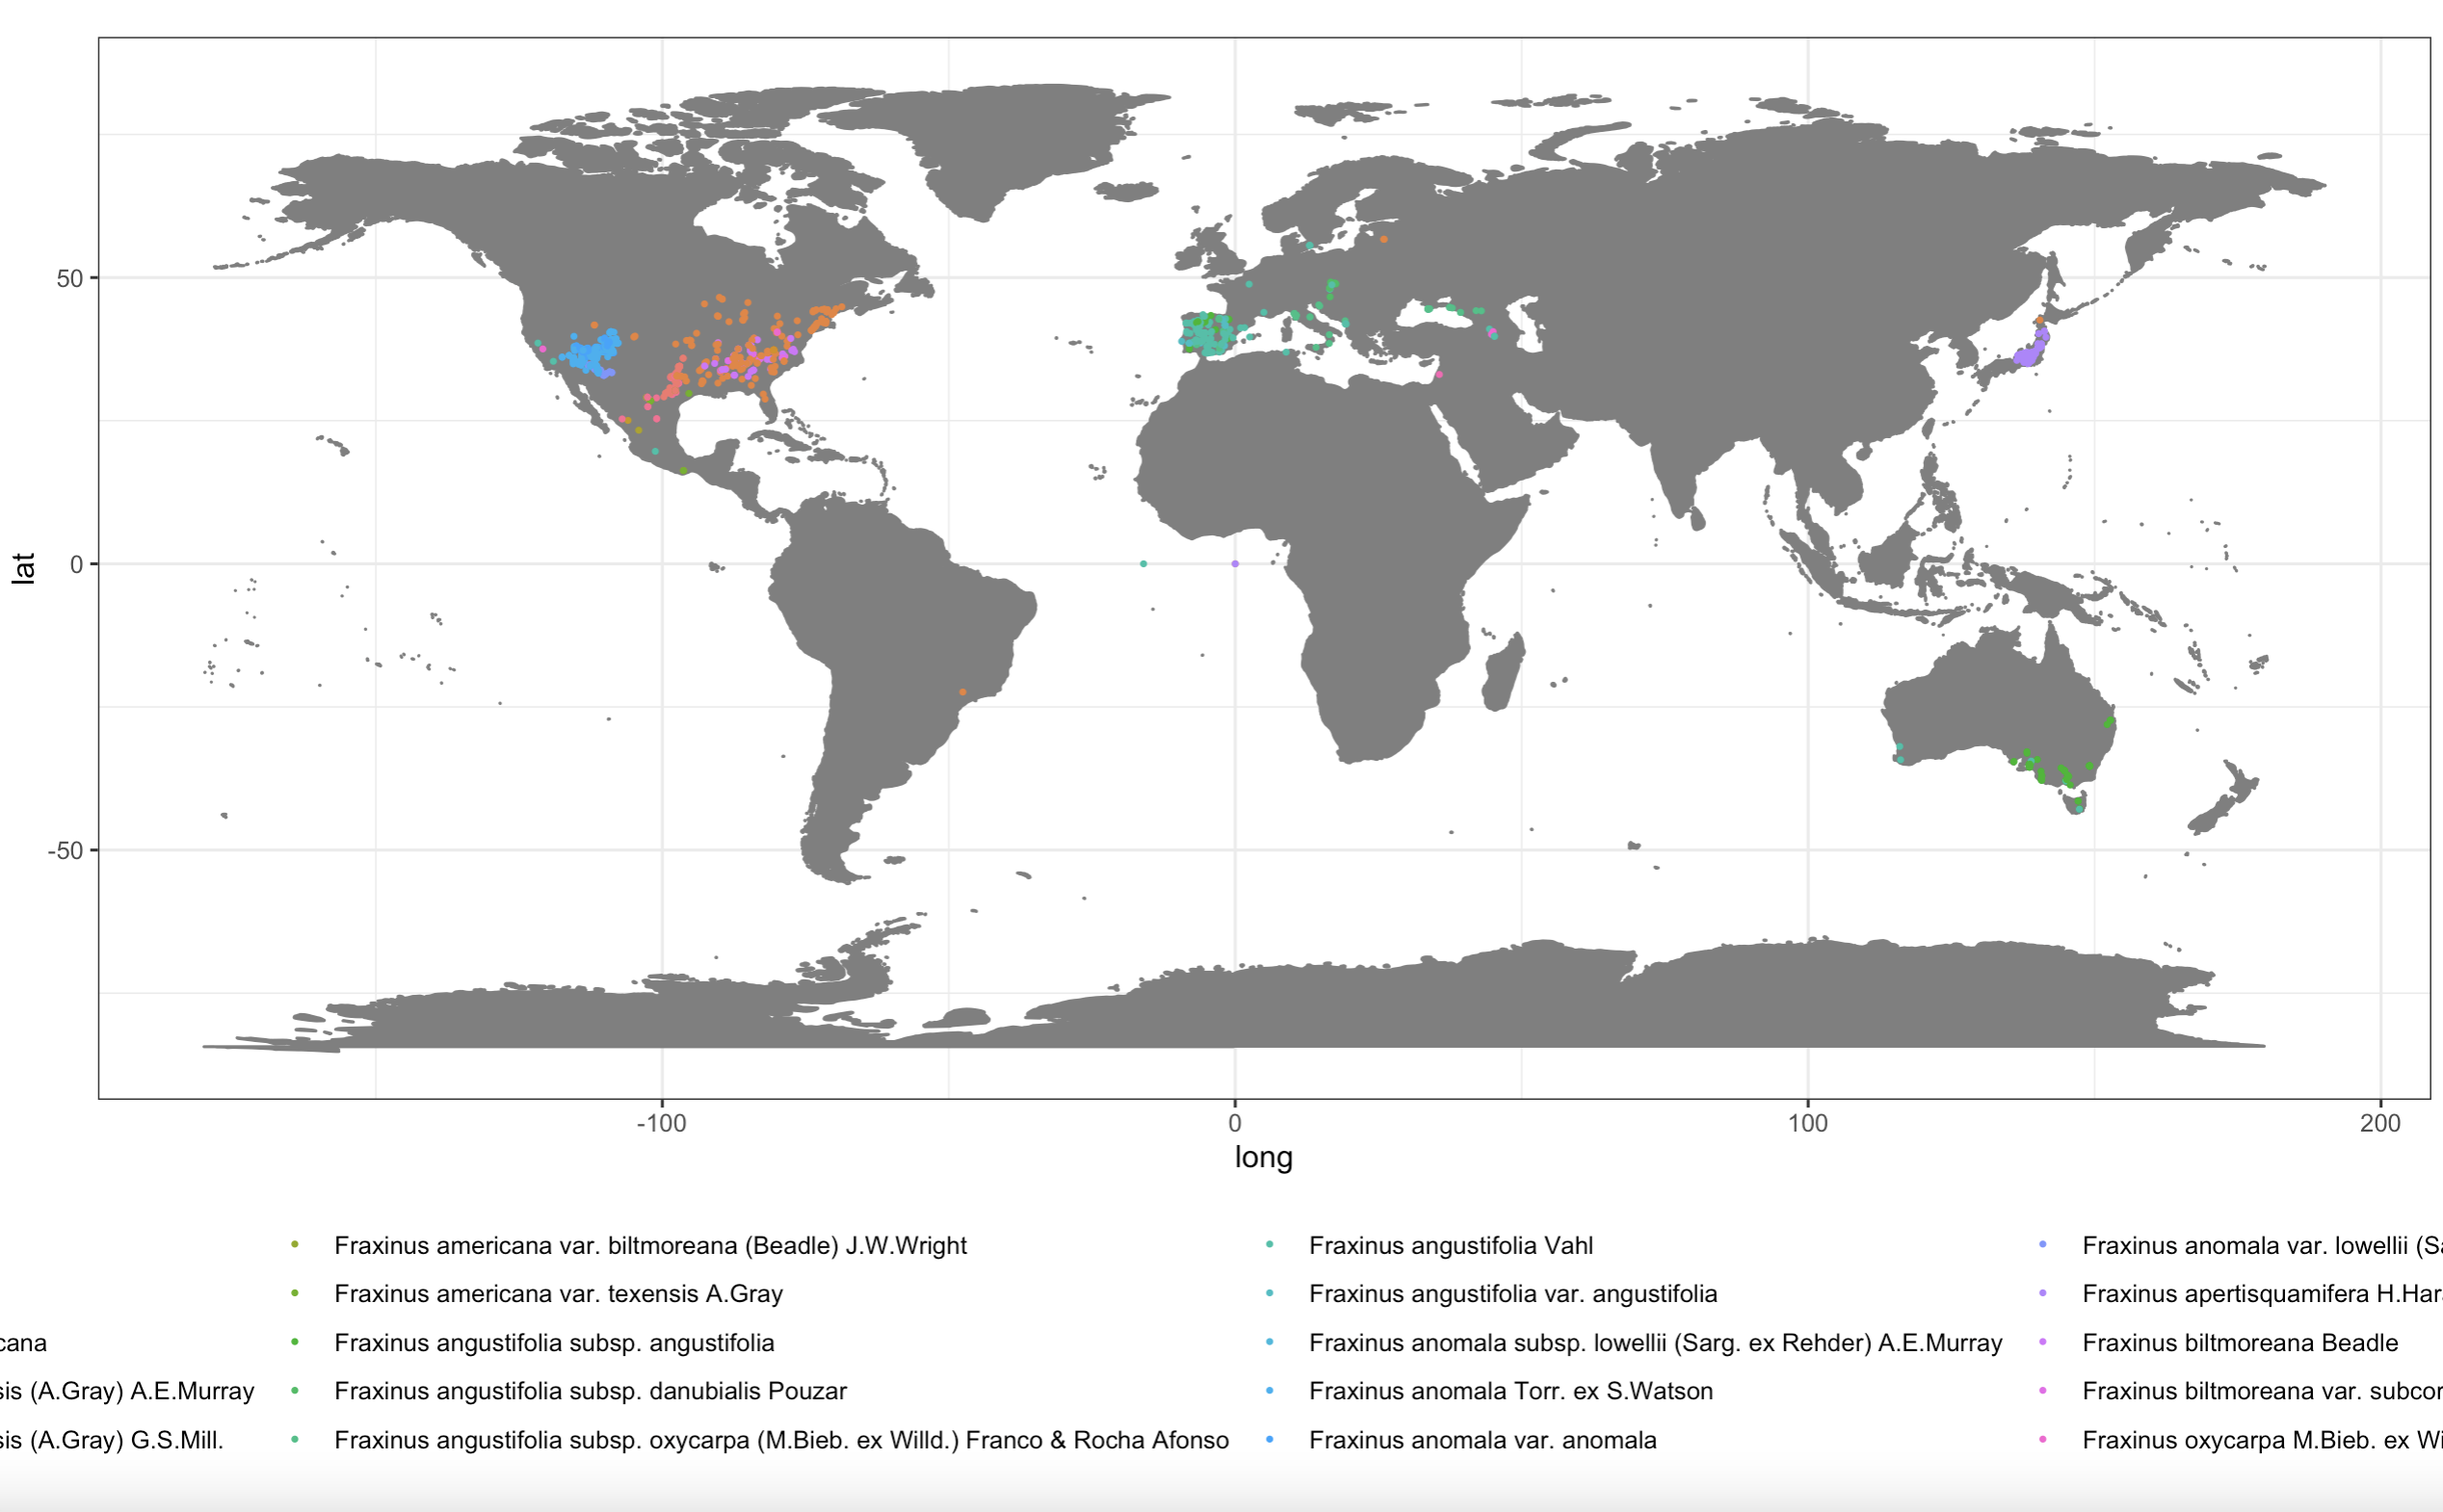
The goal of this mini-workshop is to map multiple Fraxinus species in one plot. In order to do this, I will need to download the data for each Fraxinus species, combine each respective dataset into one dataframe, and then can use this dataframe to plot the range of multiple species.
0.2 Iteration Examples
For Loops
The first method I’ll will use is For Loops, which essentially repeats the code you’ve written across different input values (i). For example,
for(i in 1:10) {
  print(i)
}
We will need to create an empty dataframe to save the results of the loop
results <- rep(NA, 10)

for(i in 1:10) {
  results[i] <- i*10
}
Now let’s try to translate this to the GBIF example.
# Now let's try bringing in multiple species
## create list of all Fraxinus species
species_names <- read.csv("fraxinus_species.csv") %>% #I scraped this list off the GBIF website
  dplyr::select(Name)%>%
  as.list()

species_names

## For time sake I'll select the first few species
species <- c("Fraxinus albicans Buckley", "Fraxinus americana", "Fraxinus angustifolia", "Fraxinus anomala", "Fraxinus apertisquamifera")

### Let's just select columns of interest across datasets:
colnames(df_FP)
### Columns we want: "scientificName", "decimalLatitude","decimalLongitude"

## Function
download_data <- function(x){
  GBIFdata <-  occ_search(scientificName = x, limit = 300, hasCoordinate = TRUE, basisOfRecord = "PRESERVED_SPECIMEN")
  dat <-  GBIFdata$data
  dat <- dat %>%
  filter(scientificName != "NA") %>% #get rid of species name with "NA"
  dplyr::select(scientificName, decimalLatitude, decimalLongitude)
return(dat)
}

## create empty data frame
comb_species <- data.frame()

## Run the for loop
for(i in species) {
  df <- download_data(i)
  comb_species <- bind_rows(comb_species, df)
}
Apply functions Another option for iteration are apply functions in base R. Check out this tutorial for more information: https://ademos.people.uic.edu/Chapter4.html. They often run faster than for loops & can be a lot simpler to set up!
comb_species_apply <- lapply(species, FUN = download_data) #spits out a list!

# how to go from list to dataframe?
# do.call calls the function you specify and runs it on the next argument
comb_species_apply_df <- do.call("bind_rows", comb_species_apply) #this will turn the list into a dataframe
Map functions
Apply functions are very handy, but for those dedicated to tidyverse you might be interested in the map family of functions from the purrr package (which is in the tidyverse suite of packages). Check out this tutorial for more: https://jennybc.github.io/purrr-tutorial/
comb_species_map <- purrr::map(species, .f = download_data)
comb_species_map_df <- do.call("bind_rows", comb_species_apply)
0.3 Final Plot
Now let’s make a nice plot!
wm = borders("world", colour="gray50", fill="gray50") #map backgroud

ggplot2::ggplot()+
  coord_fixed() +
  wm +
  geom_point(data = comb_species, aes(x = decimalLongitude, y = decimalLatitude, color = scientificName),size = 0.5) +
  theme_bw() +
  theme(legend.position = "bottom")